How to Create Interactive Infographics: Tips and Best Practices
Insights, Tips & Tricks
Written by
joost

Infographics have a long (Internet long…) history of being *highly* shareable. But what about interactive infographics?
Infographics are:
- Visual
- High-value
- And perfectly formatted for mobile devices
In fact, at one point, they were the most shared type of content in the digital world.
However, video has now largely overtaken static content in the shareability department.
And while infographics are still powerful and effective, they need a little extra something to stand out.
But what happens when you take the infographic to a whole different level?
When you add interactivity, such as clickable elements, pop-ups, animations, and more?
You get a revitalized content medium as powerful as the original infographic in its prime.
Table of contents:
Below, we’ll take you through some of the best interactive infographic examples online.
Plus, we’ll show you a few options for creating your own interactive infographics simply and easily.
Plus, we’ll show you a few options for creating your own interactive infographics simply and easily.
First, let’s start with what an interactive infographic actually is.
What is an Interactive Infographic?
An interactive infographic is simply an infographic with interactive elements, such as:
- Embedded video or audio
- Popups
- Clickable elements
- Animations
- Etc.
For example, take a look at these hover effects and clickable elements in this infographic by CBIZ.com:
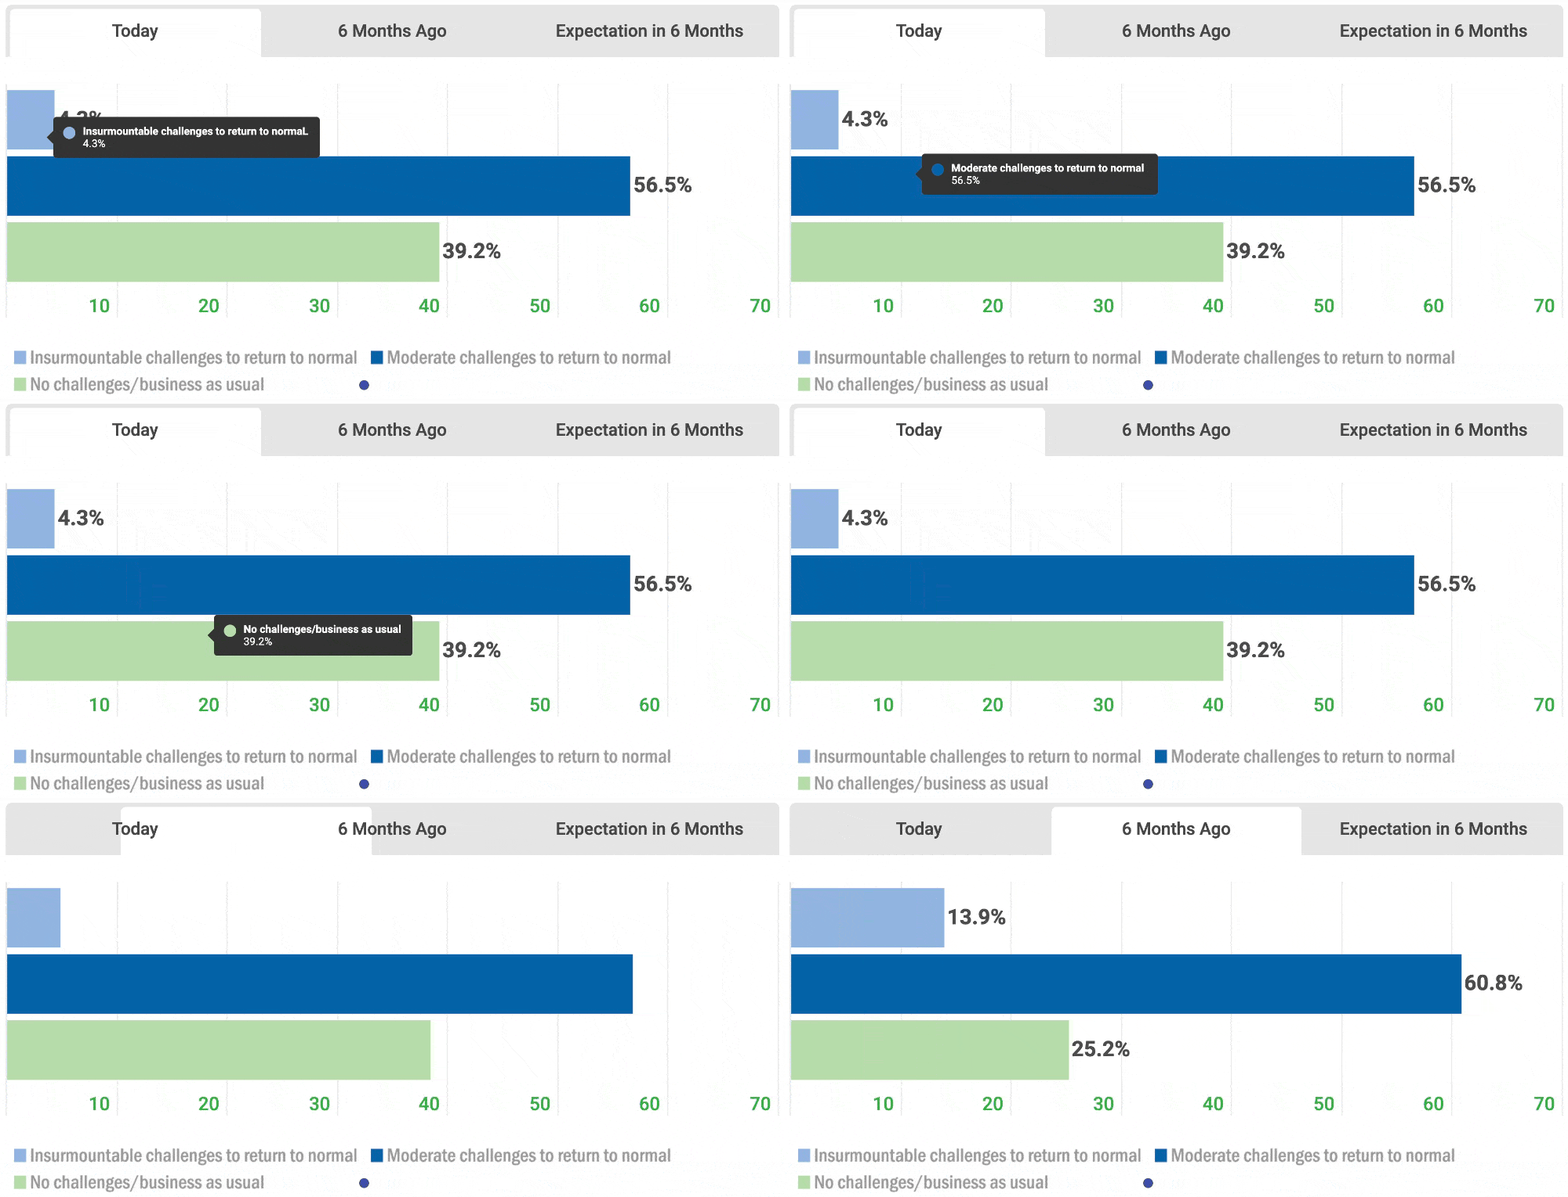
Simple, but powerful and allows CBIZ to offer more value in a single infographic. But that is just the beginning.
You can do all kinds of things with interactive features infographics.
So, let’s dive into some examples so you can get a better idea of some of the interactive elements you can incorporate into your infographics.
3 Best interactive infographics examples
Below are 3 of the best interactive infographics examples you can find.
We went with a good mix of features, from more over-the-top to simple and straightforward, to cover every budget and ambition.
Here they are:
1. The Enlightened Happy Hour - Column Five
Our first example takes the typical infographic and turns it into a “clickthrough experience” of sorts.
The structure is virtually the same as any infographic. However, the way it’s delivered completely changes the way the user interacts with the content:
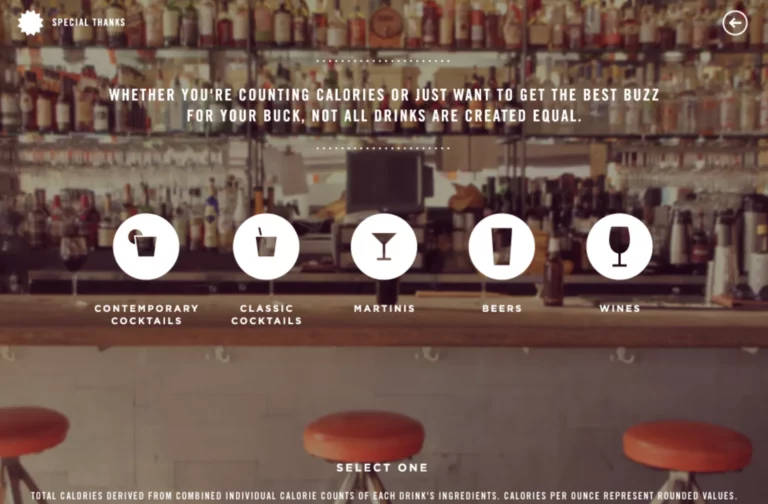
In terms of interactive infographic elements, it uses clickable areas via hotspots, allowing you to click on a section of an image to move to a relevant next step while clicking on a different section of the image will take you to a different next step.
It’s a super fun way to learn about any subject and acts as the perfect content format here particularly.
2. Family Fun in Scottsdale - Marriott
This super fun interactive infographic example, titled Family Fun in Scottsdale, is from Marriott Hotels:

If you’re planning on traveling over the Summer in the Scottsdale area, let Marriott help with this convenient travel planner.
As you move through the infographic, you’re posed with questions that will then lead you down one of several paths, eventually landing on suggested locations to visit or things to do.
Run through it a couple of times based on what you’re interested in and, before you know it, you’ll have your whole trip planned.
And, when you do, you just might think of staying at a Mariott hotel. Talking about good marketing.
3. Lunar cycle and sleep - University of Washington
The University of Washington created this engaging infographic using the data from a study it published:
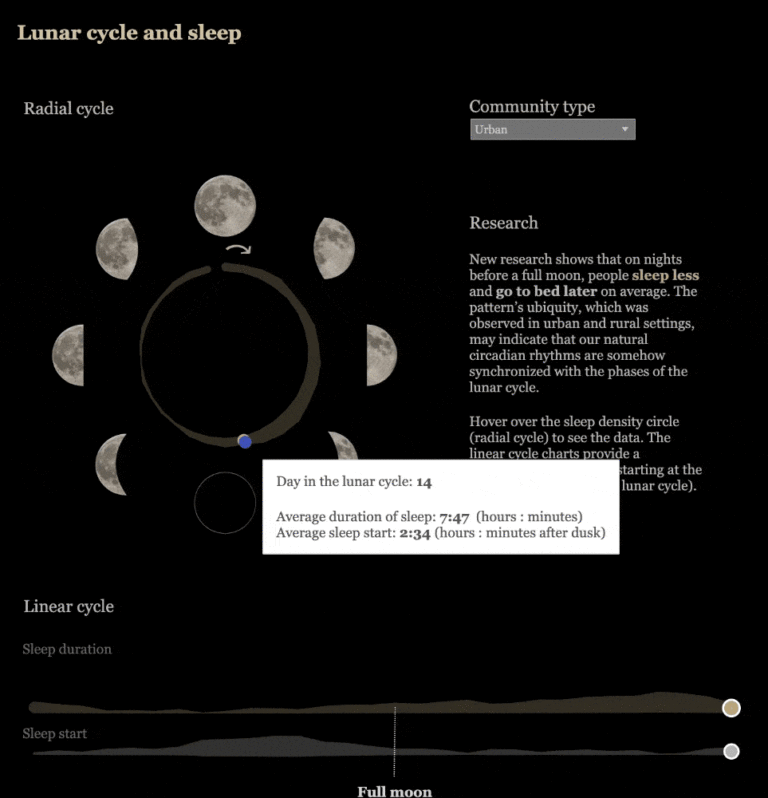
As you scroll around the circle, you get additional information via a hover effect for each moon phase, while two additional metrics below show how the average sleep duration and sleep start point are affected by said moon phase.
Interactive infographics aren’t just useful for brands, it’s also useful for non-profits and other organizations trying to create more engaging and effective learning tools. This is a great example of that.
3. Awesome Interactive Infographics makers
Now that you’ve gotten some great examples of interactive infographics, it’s time to see how to make interactive infographics.
Fortunately, several platforms allow you to add interactive elements to infographics.
Here are a few:
1. Infogram
Infogram is an infographic creator with a ton of great templates that make it easy to get started.
They offer several basic interactivity features, such as:
- Hover effects
- Video, and
- Animations
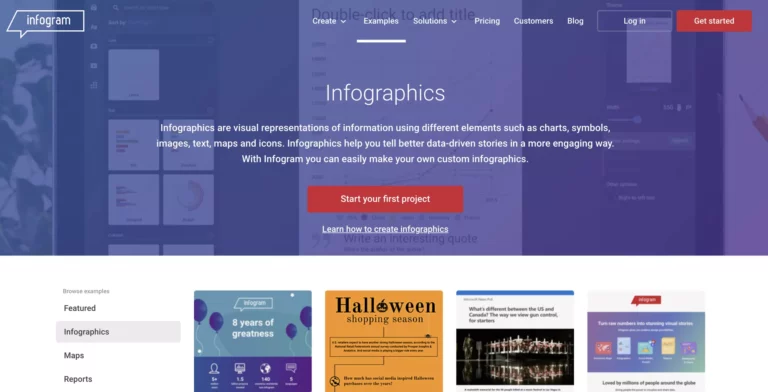
If you’re looking for a platform that makes it easy to get started creating your first interactive infographic, Infogram is a great place to start.
You even have a free interactive infographic option if you want to try it out right away!
2. Visually
Visually, by Rock Content, offers a great service that allows you to get a custom interactive infographic made for an affordable price.
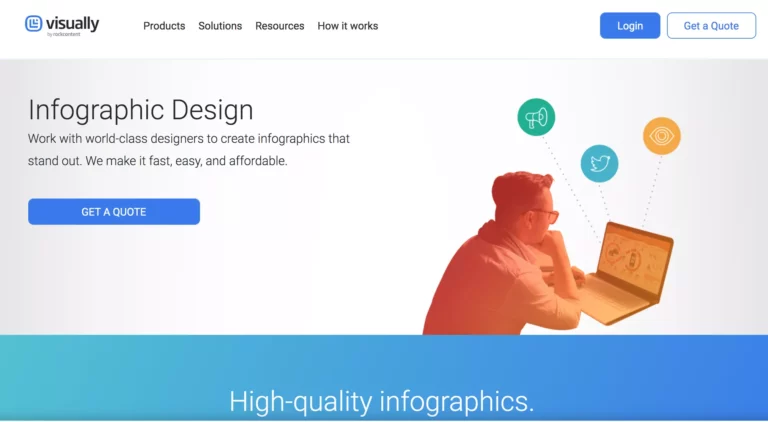
With Visually, you can take advantage of awesome interactive features such as:
- Hover effects
- Clickable elements
- Animations
- And more
If you’re more interested in paying an expert to take care of things than doing it yourself, but you don’t want to spend the time it typically takes to find and hire talent, Visually is a great option.
3. Visme
Visme is a content platform that allows you to create multiple types of interactive content, including interactive infographics and PDFs.
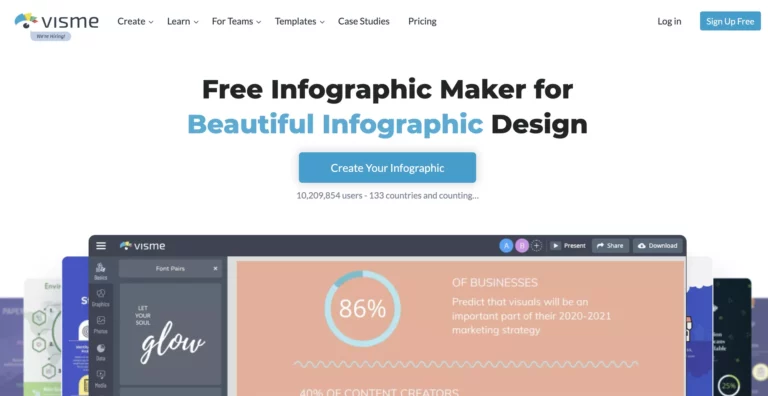
With Visme’s infographic maker, you can use interactive features such as:
- Interactive maps
- Video and audio
- Animations and gestures
Plus, the best part is, you can get started for free, making it the perfect starting point for digging into interactive infographics.
Elevate your content game with interactive infographics
Infographics are just one of the content mediums you can add interactivity to.
However, across the board, the one thing that’s consistent is that interactive content converts better than typical static content.
